Hurricane Michael Data Call Summary

Data Call Reporting
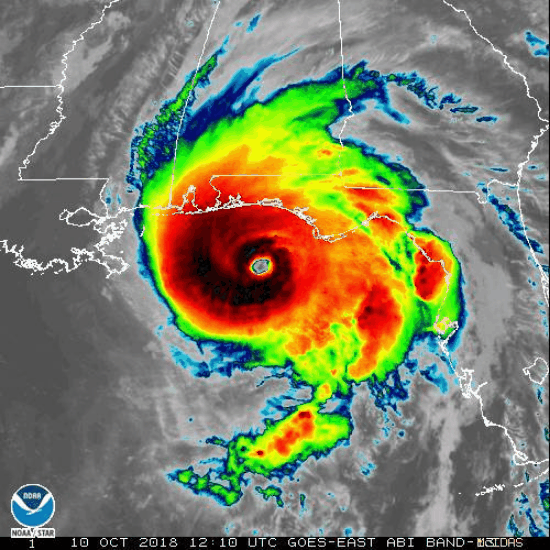
Since Hurricane Michael made landfall as a Category 5 hurricane on the Florida Panhandle on Wednesday, October 10, 2018, the OIR has conducted 44 distinct Hurricane Michael data calls. Reporting includes:
- Daily data calls beginning October 12, 2018 through November 9, 2018;
- Weekly data calls beginning November 16, 2018 through February 22, 2019;
- Bimonthly data calls from March 15, 2019 to April 26, 2019; and
- Monthly calls from May 31, 2019 through October 26, 2019.
The reporting of claims for Hurricane Michael is cumulative and OIR compels all insurers to report data as of each required reporting date, per section 624.307, Florida Statutes.
To learn more about the data collected as part of the catastrophe reporting, including the additional enhanced data call and Claims Survey applicable to the August, September and October 2019 data calls, please visit https://floir.com/Sections/PandC/ProductReview/CatastropheReporting.aspx
Although the data provided by the insurers is reviewed by OIR when it is received, it is not immediately audited or independently verified by on-site visits. If the data indicates obvious errors, OIR requires the insurance company to review and, if necessary, resubmit its data.
OIR continues to evaluate data call responses and other data for potential violations of Florida law by insurers.
Source: National Oceanic and Atmospheric Administration (NOAA), U.S. Department of Commerce.
Executive Summary
As of October 25, 2019, insurers reported the total number of claims for Hurricane Michael is 149,773 with more than $7.4 billion in estimated insured losses. This includes 99,554 residential property claims, 11,152 commercial property claims, 242 private flood claims, 872 business interruption claims and 37,953 other lines of business claims.
- Insurers report having closed a total of 133,880 claims, which represents 89.4% of all claims filed to date. Of those claims, 112,900 were closed with payment, 20,980 were closed without payment1, and 11,401 personal residential claims remain open.¹
- From September to October 2019, the number of reported open claims decreased by approximately 8%, which is almost double the rate from August to September 2019.
- The number of reported closed claims without payment has decreased. This may indicate insurers may have reopened claims after determining the policyholder met the deductible; after determining that coverage, which was previously not afforded, was able to be afforded under the policy. The OIR Market Conduct unit is reaching out to companies regarding the data to review the handling of these claims.
- Insurers reported the top five reasons claims remained opened which included:
- Awaiting documentation from insured or involved parties;
- Waiting for repairs to be made or completed;
- Engineer and contractor issues in agreed pricing, rates or shortage;
- Public Adjuster and attorney issues with soliciting for increased settlement or awaiting final adjustments; and
- Supplemental claims handling and payment issues.
OIR is currently conducting seven examinations of 11 insurers to review Hurricane Michael claims handling practices, per section 624.3161, Florida Statutes.
The following graphics display data submitted by insurance companies. These graphics are a tool to provide a current snapshot regarding Hurricane Michael’s impact on Florida.
1. The most common reasons to close a claim without payment are that the damage did not exceed the hurricane deductible, or the policy did not cover the cause of loss, for instance the damage was caused by flood and the policy did not provide coverage for flood damage.
Florida Counties Impacted by Hurricane Michael
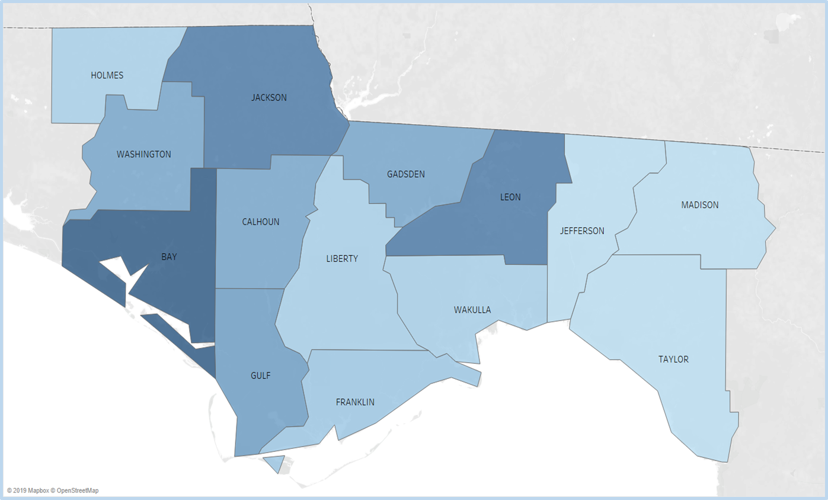
Bay County had the highest number of reported claims from Hurricane Michael, with 89,772 claims accounting for almost 60% of all claims filed. Jackson County had 14,047 claims, Leon County had 10,236 claims, and Gulf County had 8,254 claims. (Data through October 25, 2019)
Open and Closed Claims by Line of Business
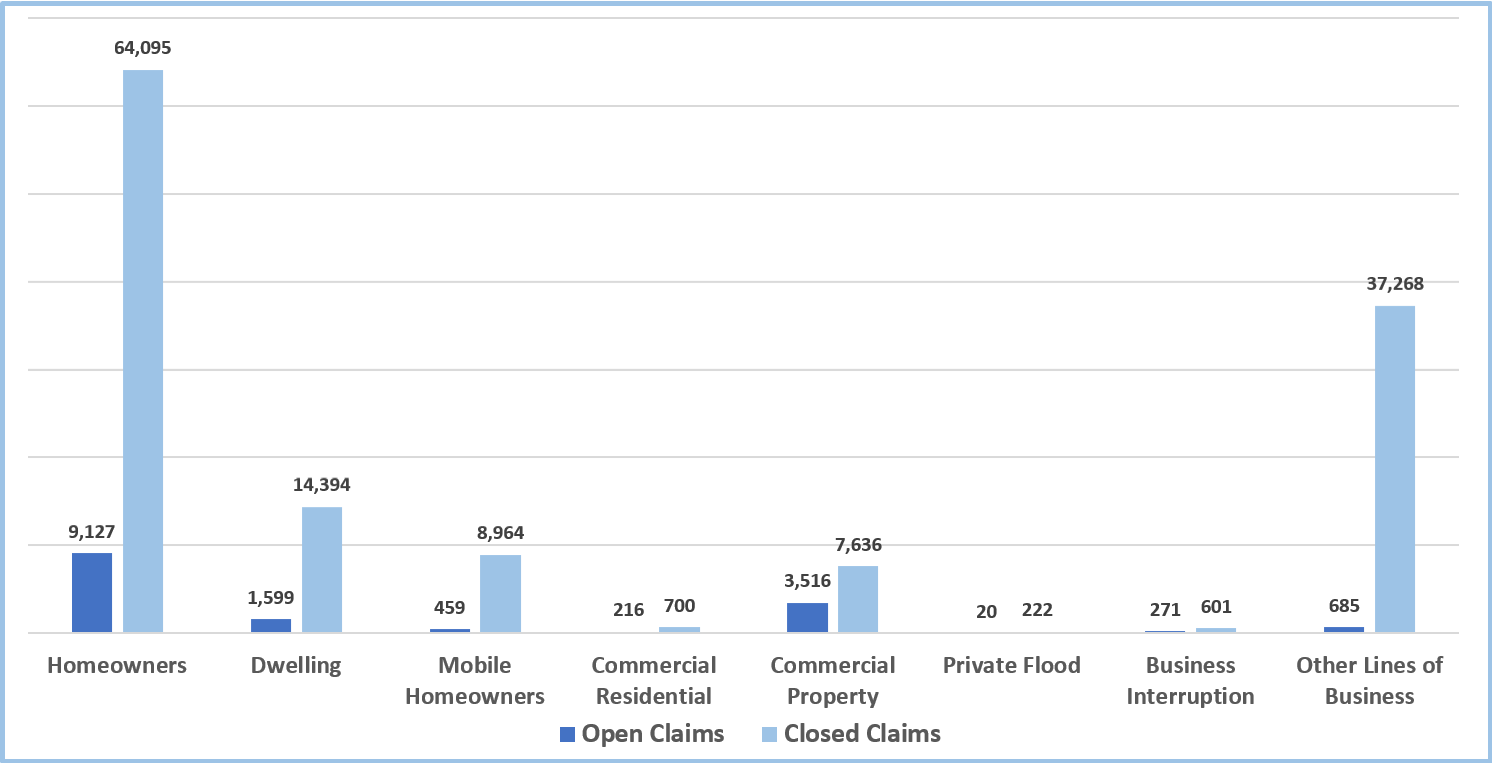
The above chart lists the number of open and closed claims by line of business as reported on October 25, 2019, for Homeowners, Dwelling, Mobile Homeowners, Commercial Residential, Commercial Property, Private Flood, Business Interruption, and Other Lines of Business.
Paid Losses by Line of Business
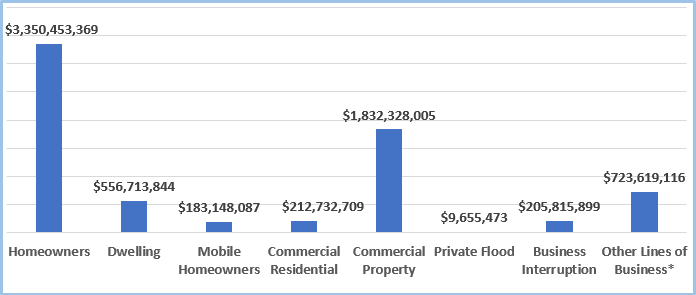
Insurers reported, of the more than $7 billion in paid losses, homeowners’ coverage represents 47.4% or $3.4 billion of paid claims, followed by commercial property at 25.9% or $1.7 billion. Paid losses are indemnity payments that exclude adjustment expense. Payments are the net of actual salvage and subrogation recoveries. For applicable lines, they include losses associated with loss of use, additional living expense, fair rental value and other factors.
Paid Losses by Month
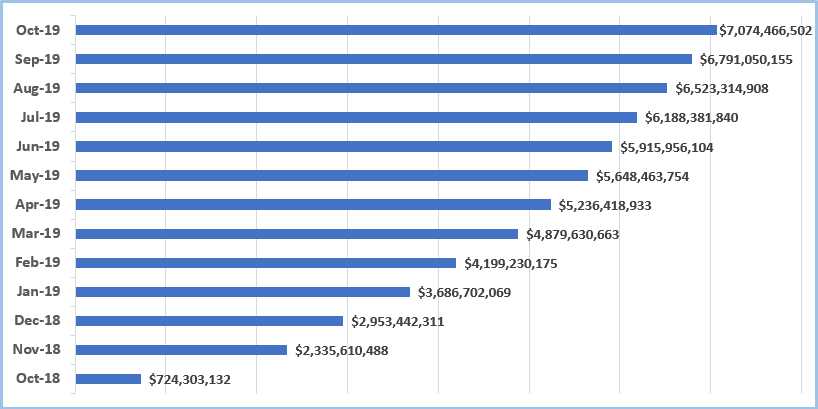
The above graph represents the progression of paid losses reported monthly as of the date for each data call.
A Comparison of Hurricane Michael and Hurricane Irma
While Hurricane Irma affected a much larger area of the state, insurers report that Hurricane Michael is a costlier storm when comparing the number of claims with the amount of paid losses. As represented in the chart below, Hurricane Irma produced over one million claims, costing more than $10.8 billion with an average claims cost of $10,800. Conversely, Hurricane Michael, with 149,448 claims, produced more than $7 billion in paid with an average claims cost of $62,661.²
Paid Loss for Hurricane Michael and Hurricane Irma
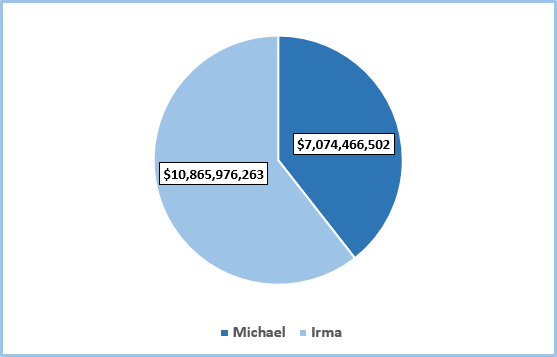
2. Hurricane Irma losses are as of November 14, 2018, approximately 14 months after the storm as compared to Hurricane Michael losses at approximately 13 months after the storm.
Comparison of Hurricane Irma and Hurricane Michael Claims Status
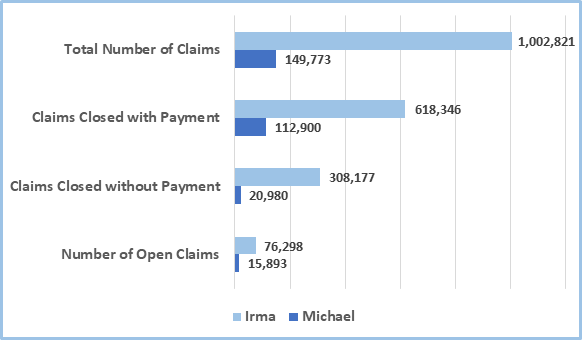
The above graphic provides a comparison of the reported claims’ status for the 13-month time period following Hurricane Michael and the 14-month time period following Hurricane Irma.