Hurricane Michael Claims Data
The Florida Office of Insurance Regulation (OIR) captures data in its efforts to evaluate the catastrophe claims handling processes of insurers, identify claim payment trends, isolate reasons that claims remain open
and document potential violations of Florida law by insurers.
OIR compels all insurers to report data as of each required reporting date, per section 624.307, Florida Statutes.
On multiple occasions, OIR has directed insurers with Hurricane Michael claims to not only comply with required provisions of Florida law, but to do everything possible to respond to the needs of affected Floridians
and facilitate restoration and recovery in impacted communities. Please see OIR Informational Memorandum OIR-19-01M
issued January 8, 2019, addressing policyholders impacted by Hurricane Michael, and Informational Memorandum OIR-19-04M issued July 25, 2019, addressing the Hurricane
Michael claims response.
Since Hurricane Michael made landfall as a Category 5 hurricane on the Florida Panhandle on Wednesday, October 10, 2018, the OIR has conducted 46 distinct Hurricane Michael data calls. Reporting includes:
- Daily data calls beginning October 12, 2018 through November 9, 2018;
- Weekly data calls beginning November 16, 2018 through February 22, 2019;
- Bimonthly data calls from March 15, 2019 to April 26, 2019;
- Monthly calls from May 31, 2019 through October 26, 2019; and
- As requested by OIR, including the December 13, 2019, and November 2, 2020, data calls.
For the data call summary as of December 13, 2019, click here.
For the data call summary as of November 12, 2019, click here.
For the data call summary as of October 25, 2019, click here.
For Consumers
OIR encourages consumers who are having issues with a claim to report it. Click here to report an issue with a claim.
Data as of November 2, 2020
| Lines of Business |
Number of Claims Reported |
Number of Open Claims with Payment |
Number of Open Claims without Payment |
Number of Claims Closed with Payment |
Number of Claims Closed without Payment |
Percent of Claims Closed |
| Residential Property |
101,932 |
4,901 |
530 |
82,462 |
14,039 |
94.7% |
| Homeowners |
75,162 |
3,945 |
372 |
60,299 |
10,546 |
94.3% |
| Dwelling |
16,123 |
570 |
79 |
13,012 |
2,462 |
96.0% |
| Mobile Homeowners |
9,161 |
239 |
29 |
8,243 |
650 |
97.1% |
| Commercial Residential |
1,486 |
147 |
50 |
908 |
381 |
86.7% |
| Commercial Property |
11,873 |
1,438 |
434 |
7,236 |
2,765 |
84.2% |
| Private Flood |
598 |
7 |
2 |
426 |
163 |
98.5% |
| Business Interruption |
918 |
71 |
36 |
575 |
236 |
88.3% |
| Other Lines of Business* |
43,670 |
109 |
44 |
38,957 |
4,560 |
99.6% |
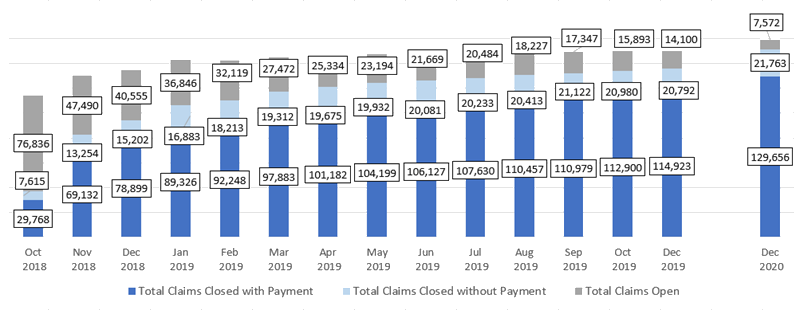
| TOTALS |
158,991 |
6,526 |
1,046 |
129,656 |
21,763 |
95.2% |
*Other Lines of Business may include Fire, Farmowners’ Multi-Peril, Ocean Marine, Inland Marine, Private Passenger Automobile Physical Damage, Commercial Auto Physical Damage, Aircraft, Glass,
Boiler and Machinery, Industrial Fire, Industrial Extended Coverage, and Multi-Peril Crop.
Hurricane Michael Claims Status by Filing Deadline
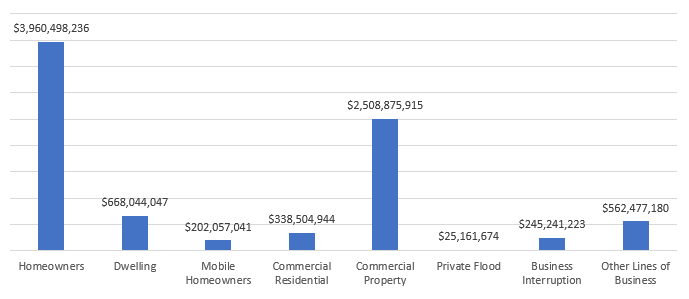
Paid Losses by Line of Business
Paid losses include indemnity payments but excludes loss adjustment expenses.
Total Paid Losses: $8,510,860,259
(Paid Losses by Line of Business Chart)
Total Estimated Losses
The OIR required insurers report estimated and paid losses. Estimated or case incurred losses, include indemnity case reserves and payments to date.
Total Estimated Insured Losses: $9,132,526,254
Claims Data as of December 13, 2019, by County
| County* |
Number of Claims |
Number of Open Claims with Payment |
Number of Open Claims without Payment |
Claims Closed with Payment |
Number of Claims Closed without Payment |
Percent of Claims Closed |
| BAY |
95,184 |
4,795 |
522 |
80,037 |
9,830 |
94.4% |
| CALHOUN |
4,429 |
102 |
31 |
3,993 |
303 |
97.0% |
| FRANKLIN |
2,404 |
52 |
9 |
1,454 |
889 |
97.5% |
| GADSDEN |
6,398 |
229 |
60 |
5,034 |
1,075 |
95.5% |
| GULF |
7,810 |
358 |
20 |
6,227 |
1,205 |
95.2% |
| HOLMES |
1,169 |
22 |
16 |
893 |
238 |
96.7% |
| JACKSON |
14,834 |
526 |
57 |
12,964 |
1,287 |
96.1% |
| JEFFERSON |
192 |
1 |
2 |
134 |
55 |
98.4% |
| LEON |
10,569 |
128 |
91 |
7,353 |
2,997 |
97.9% |
| LIBERTY |
1,220 |
14 |
1 |
1,092 |
113 |
98.8% |
| MADISON |
51 |
1 |
0 |
36 |
14 |
98.0% |
| TAYLOR |
70 |
0 |
0 |
52 |
18 |
100.0% |
| WAKULLA |
1,444 |
13 |
5 |
1,011 |
415 |
98.8% |
| WASHINGTON |
3,546 |
71 |
35 |
2,976 |
464 |
97.0% |
| REST OF THE STATE |
9,671 |
214 |
197 |
6,400 |
2,860 |
95.8% |
| TOTAL |
158,991 |
6,526 |
1,046 |
129,656 |
21,763 |
95.2% |
*Hamilton and Suwannee counties have been removed due to claims of Trade Secret.
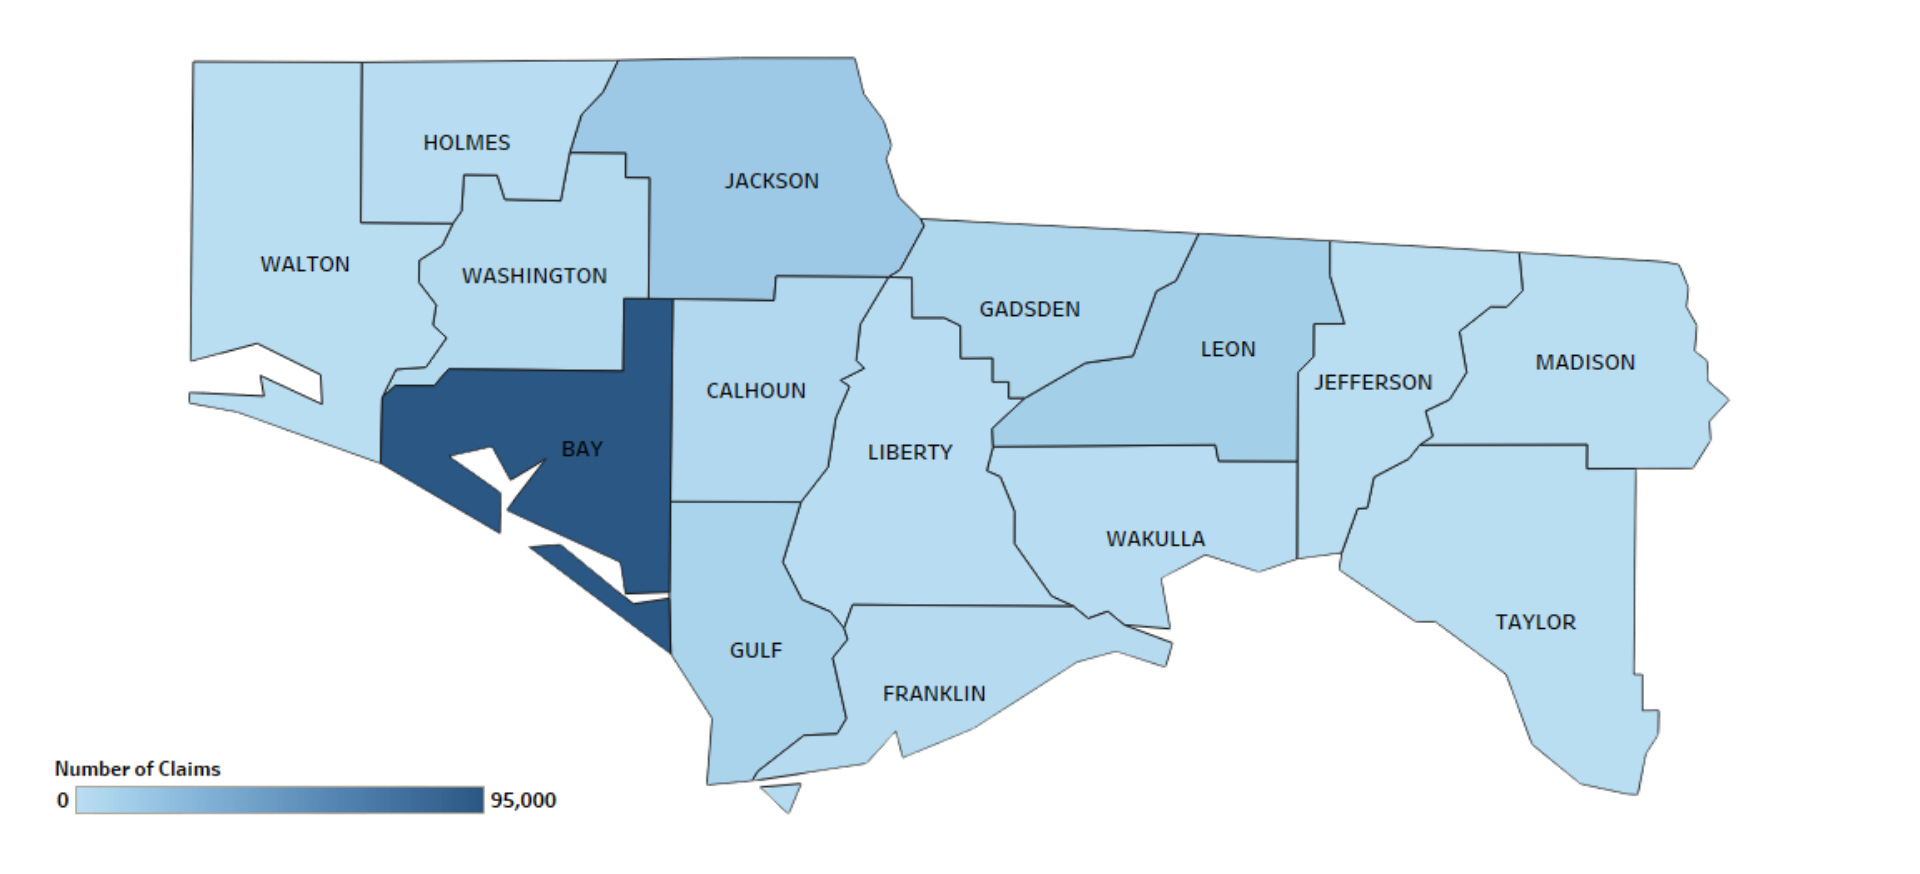
Total Number of Claims in Panhandle Region
There were 149,320* claims reported in the Panhandle region.
Bay County had the highest number of reported claims, with 95,184 claims accounting for almost 60% of all claims filed as a result of Hurricane Michael.
There were 14,834 claims reported in Jackson County, 10,569 claims reported in Leon County, and 7,810 claims reported in Gulf County.
Total Claims Reported by Zip Code
For the November 2, 2020 data call, all reporting insurers provided zip code level data.
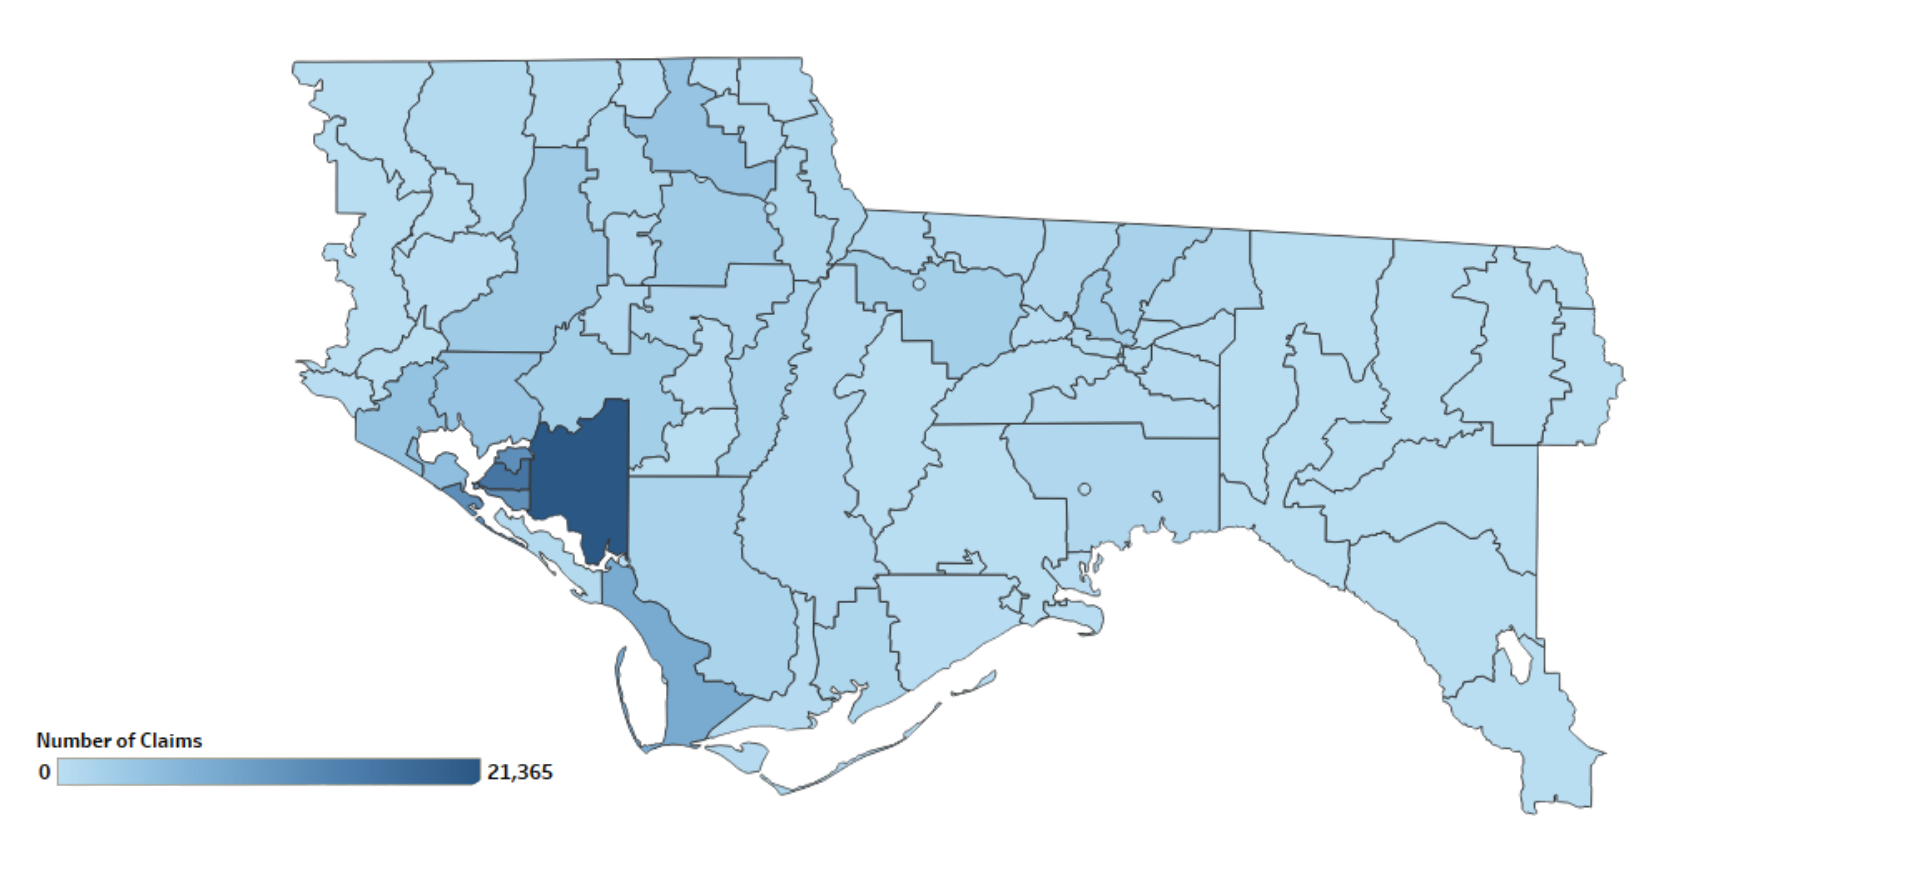
The numbers in the legend are an approximation of the claims and not the actual number of claims due to trade secret protections. Boundaries are presented by zip code.
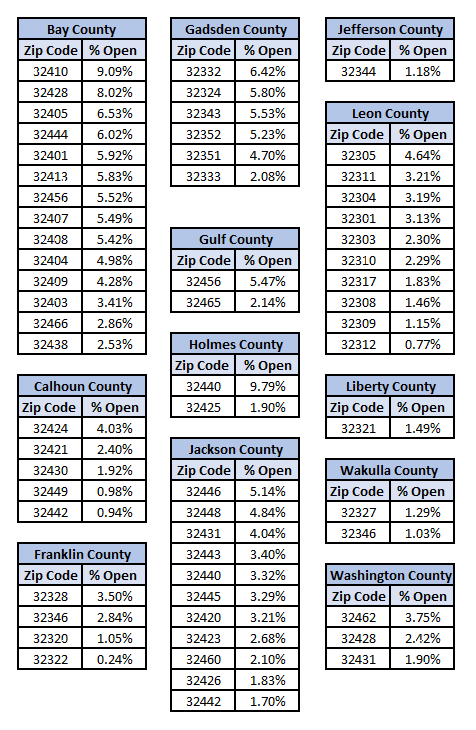
Total Open Claims by Zip Code
Below represents the reported percent of open claims by zip code as compared to the total number of claims filed, for zip codes with greater than 100 total claims. Not all insurers reported
data by zip code. Zip codes with no open claims are not represented in this chart.
Number of Open Claims by Category for All Lines of Business
The OIR requested insurers to provide a breakdown of open claims using the following categories. These categories may not be inclusive of all possible categories for open claims and claims may be represented in multiple categories.